Product Demo Video ROI: How to Measure It (And Prove It to Leadership)
Someone asks you in a QBR: "What's the ROI on those demo videos?" You pull up the video analytics dashboard. You say something about view counts and completion rates. Leadership nods, moves on, and files demo video firmly in the "nice to have" column.
That's the moment most video programs start dying. Not because the videos don't work — because nobody proved they did.
The problem isn't measurement tools. Most B2B SaaS teams already have Wistia, Vidyard, or similar platforms generating dashboards full of data. The problem is that teams measure product demo videos like content marketing assets — reach, engagement, awareness — when what leadership needs to see is pipeline and revenue impact. Those are fundamentally different questions, and answering the wrong one with the right data still won't move budget.
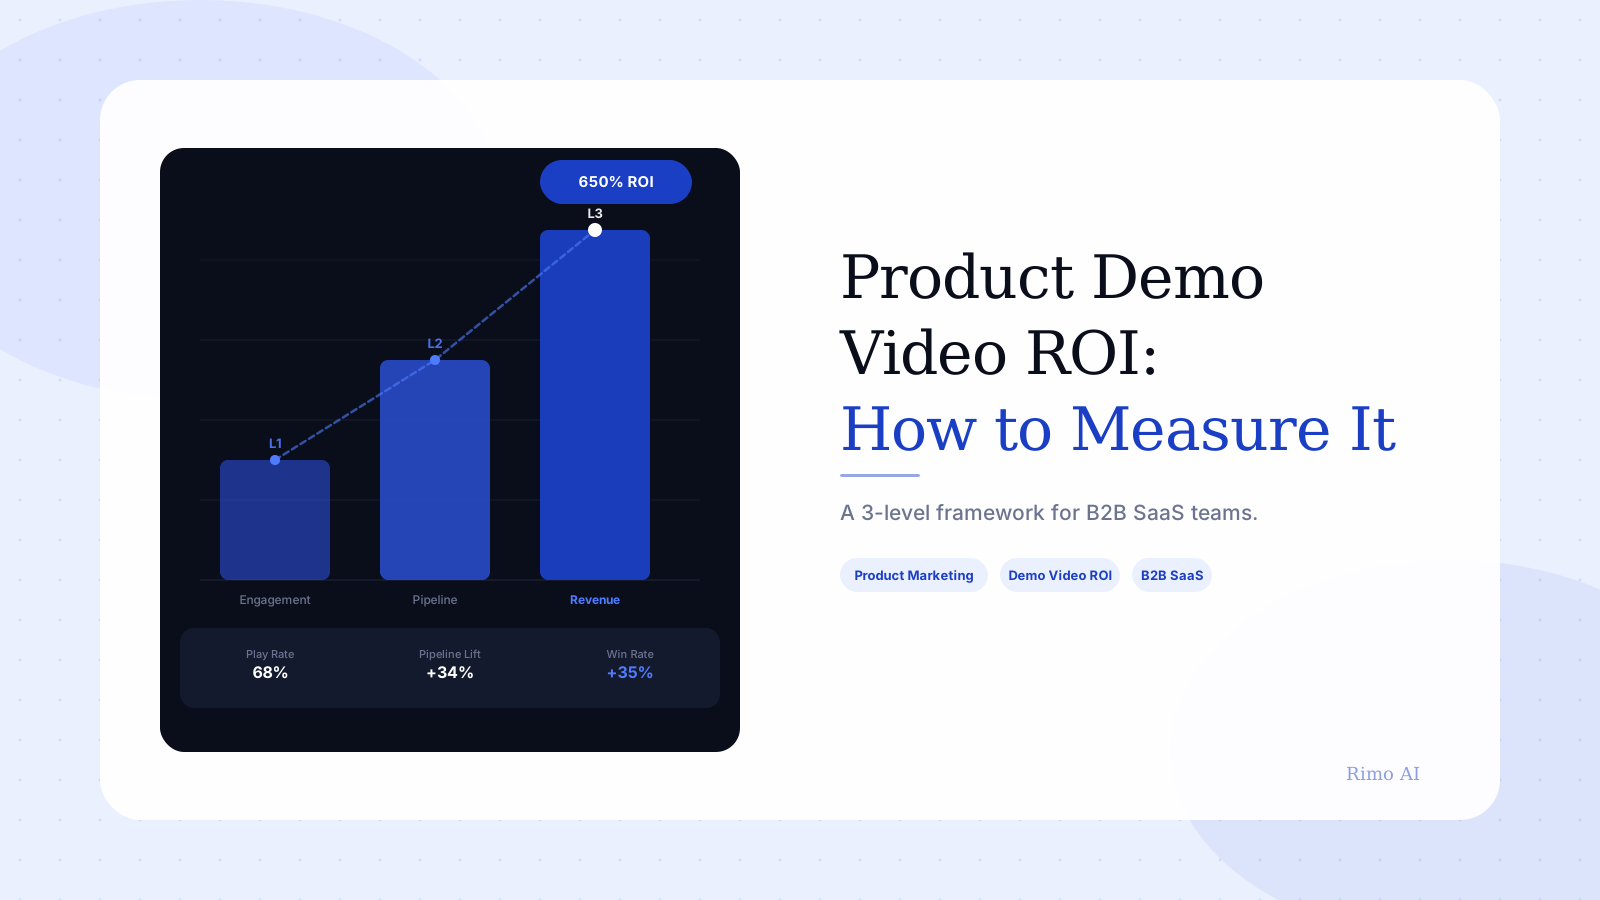
This guide gives you a three-level framework for measuring product demo video ROI: what to track at each level, how to build attribution without a data engineering project, and what a defensible ROI calculation actually looks like. If you've been sitting on a video program that feels valuable but can't prove it, this is where to start.
In this guide
- Why product demo video ROI goes unmeasured
- The 3 levels of product demo video ROI measurement
- The product demo video ROI formula
- How to set up video attribution in three steps
- What good product demo video ROI looks like
- The hidden ROI killer: stale demo content
- How to improve ROI without rebuilding everything
- FAQ
Why product demo video ROI goes unmeasured
Vidyard's research found that 22% of B2B teams admit they don't measure video performance at all. Of those that do, most stop at play count and completion rate — engagement signals that tell you what happened to the video, not what happened to the deal.
Part of this is a tooling problem. The platforms B2B SaaS teams reach for first — Loom, Descript, Vidyard — weren't designed to connect video engagement to pipeline data. You get one dashboard for video views and a separate CRM for deal progression. Connecting the two requires deliberate setup that most teams never prioritize.
The larger part is a framing problem. Demo videos get evaluated like brand content: reach, impressions, shares. But a product demo video is a sales asset. It sits in the middle of a buying decision. It answers "does this product actually work the way they claim?" at the moment a buyer is evaluating you against three competitors. That deserves revenue-linked measurement, not a social media reporting template.
The last stat is the one that sticks: teams that optimize their video processes are 206% more likely to be tracking pipeline and revenue KPIs. The measurement doesn't follow the video quality — it follows the operational discipline around the program. You can have a great demo video and still be in the 22% if nobody built the attribution layer.
The 3 levels of product demo video ROI measurement
Measuring ROI doesn't require a months-long analytics project. It requires getting clear on which measurement level you're at today — and what it would take to move to the next one. Each level adds rigor and gets you closer to a number that actually moves budget decisions.
Level 1: Engagement quality metrics (the starting point)
Engagement metrics tell you whether the video holds attention. Play rate (what percentage of page visitors press play), completion rate, average watch time, and drop-off points are all Level 1.
Don't mistake engagement for ROI. A 72% completion rate tells you the video is holding attention. It says nothing about whether that attention changed what buyers did next.
Level 1 is genuinely useful — but only for diagnosing video quality problems. A 28% play rate on a landing page is a headline or thumbnail problem. A 90% play rate but a 20% completion rate is a first-30-seconds problem. Both are fixable, but only once you know which one you have.
Level 1 targets for B2B SaaS:
- Play rate: 60%+ on dedicated landing pages; 30–40% on product pages with competing CTAs
- Completion rate: 50%+ for videos under 2 minutes (Vidyard benchmark for B2B content)
- Drop-off spike: flag any moment where 15%+ of viewers leave within 10 seconds of each other — that's a content or pacing problem, not an attention problem
Level 2: Pipeline influence metrics (where ROI gets real)
Pipeline influence answers the question "did watching this video change what the buyer did next?" It connects video engagement to downstream actions — demo bookings, trial sign-ups, pricing page visits, or any conversion event that moves a buyer toward purchase.
Landing pages with consideration-stage video see 34% higher conversion rates than equivalent pages without video, according to Vidyard's research. But that statistic is only useful if your team is actually tracking conversion rates on video versus non-video pages. Most teams aren't running that comparison. They're optimizing the video itself while leaving the surrounding measurement infrastructure untouched.
The specific pipeline influence metrics that matter:
- Demo booking rate from video viewers — what percentage of buyers who watch your demo video go on to book a call? A healthy target for B2B SaaS sits between 8–15%, depending on where the video lives in the funnel.
- Trial activation rate — what percentage of video viewers start a trial within 7 days of watching?
- Time-to-next-action — how long after watching does the buyer take the next measurable step? A shorter window suggests stronger purchase intent.
- Video-influenced pipeline total — the aggregate pipeline value from deals where a buyer watched a demo video at any point before entering the CRM as an opportunity.
The number that most surprises teams when they first build Level 2 reporting: video-influenced pipeline is typically 20–40% of total pipeline for companies with a mature video program. That's not a rounding error. That's a budget-justifying number sitting unmeasured.
Level 3: Revenue attribution (the full picture)
Revenue attribution connects video views to closed revenue — the only number leadership will act on. It's also the measurement level most B2B SaaS teams have never built, which is exactly why video programs keep getting de-prioritized at budget time.
Attribution model choice matters here, and getting it wrong in either direction is a problem. First-touch attribution gives all credit to whatever brought the buyer in — usually a paid ad or a blog post — and leaves the demo video invisible. Last-touch gives it all to the final action before close, which is often a proposal or legal review. Neither reflects the actual role a demo video plays.
For demo videos, multi-touch attribution is more accurate. It acknowledges that the video was one of several touchpoints, but that watching the product work was often the moment a deal moved from "interesting" to "evaluating." Time-decay attribution — where more credit goes to touchpoints closer to close — also works well for videos used as late-stage leave-behinds or post-discovery re-engagement.
Level 3 metrics to build toward:
- Video-influenced closed-won revenue (multi-touch attribution)
- Average deal size: video viewers vs. non-video viewers — Vidyard reports 35% of sales teams see higher win rates after adding video to their process
- Sales cycle length: video viewers vs. non-viewers — 27% of Vidyard users report shorter deal cycles from video touchpoints
- Revenue per video asset: which specific demo video drove the most attributed revenue
Stop guessing whether your demo videos work
Rimo turns a plain-English brief into a production-grade product demo video — with real screens, no editor, and a workflow fast enough to keep up with your product.
The product demo video ROI formula
The standard ROI formula is: ROI = (Revenue Generated − Cost of Investment) / Cost of Investment × 100
For demo videos, the cost side has three components most calculations ignore:
1. Production cost — the time and money to create the video. In-house: (hours spent × loaded hourly rate of team). Outsourced: vendor invoice. A professionally produced demo video from an agency typically runs $6,000–$15,000 (ContentBeta, 2026). With AI-assisted tools, the same output can be produced for under $500 in tooling costs — which changes the ROI math dramatically.
2. Maintenance cost — the cost of updating the video when the product changes. This is the most underestimated number in any demo video budget. A SaaS product that ships a major UI update every quarter creates ongoing maintenance obligation. A team spending two days every quarter updating a single demo video is spending roughly 8 days per year — at a loaded cost that often exceeds the original production investment.
3. Distribution cost — paid amplification budget, or the opportunity cost of the page real estate the video occupies. If you're running paid traffic to a video landing page, that spend is part of the ROI calculation.
An example calculation:
- Production cost: $3,000 (2 days of PMM time + Rimo)
- Annual maintenance: $600 (two quarterly updates)
- Total annual cost: $3,600
- Video-influenced pipeline (conservative multi-touch attribution): $90,000
- Average win rate: 28%
- Video-attributed closed revenue: $25,200
- ROI: ($25,200 − $3,600) / $3,600 × 100 = 600% ROI
At half that attribution — if you apply even more conservative assumptions — the number is still 250%. That's the structural advantage of a low-cost, high-leverage asset that works asynchronously around the clock. The math on demo video ROI usually holds. The problem is that nobody builds the formula.
How to set up video attribution in three steps
Step 1: Instrument every video placement with UTM parameters
Every time you embed or share a demo video, the destination URL should carry UTM tracking: source, medium, campaign, and content. utm_content=demo-video-use-case-pmm tells you not just that a visitor came from LinkedIn but that they clicked through from a specific video. Without UTMs, every video-driven visit looks identical to an organic visit in your analytics.
Also assign a unique identifier to each video asset in your hosting platform. When you eventually pull engagement data into your CRM, you need to know which video the viewer watched — not just "a video."
Step 2: Define conversion events per video placement
Decide what "conversion" means for each video before it goes live. For a homepage demo video, the conversion event might be "played video AND visited pricing page in the same session." For a post-discovery leave-behind, it might be "watched 80%+ AND booked a follow-up meeting within 72 hours."
Generic conversion tracking misses the intent signal specific to each placement. A buyer who watches 80% of your homepage video is in a fundamentally different mental state than one who watched the same percentage of a persona-specific use-case video. They need different follow-up and they should be counted differently.
Step 3: Create a "video touched" field in your CRM
This is the step that unlocks Level 3 attribution — and the one most teams skip. When a prospect watches a demo video, that interaction should be logged as a contact property in your CRM: "demo video viewed," timestamped, with the specific video identified.
In HubSpot or Salesforce, this is a custom field populated via a webhook or native integration with your video platform. Every deal record where that field is populated becomes part of your video-influenced pipeline. Run that segment against your closed-won deals and you have the attribution data for a Level 3 ROI calculation.
Without this CRM connection, you're measuring content performance, not business impact. The two look completely different in a budget conversation.
What good product demo video ROI looks like
For B2B SaaS teams with a mature measurement setup, these are realistic benchmarks at each level:
| Metric | Target range |
|---|---|
| Play rate (dedicated landing page) | 60–80% |
| Completion rate (sub-2-minute video) | 50–65% |
| Demo booking rate from video page | 8–15% |
| Video-influenced pipeline share | 20–40% of total pipeline |
| Sales cycle reduction (video vs. no video) | 15–30% faster |
| Win rate lift (video viewers vs. non-viewers) | 25–35% higher |
One important caveat: these ranges assume a well-placed video with a clear CTA, proper attribution, and at least 60 days of data. A new video on a low-traffic page won't hit these numbers in week two. Give each placement a fair measurement window before drawing conclusions.
Also: don't optimize for rate alone. A 15% demo booking rate on a $20/month SMB product and a 4% rate on a $60K ACV enterprise product produce very different revenue outcomes. Match your success metrics to the deal value, not just the percentage.
The hidden ROI killer: stale demo content
Here's what most posts on this topic miss entirely: a demo video that's accurate when published becomes a liability when it goes out of date.
Here's what happens in practice. A PMM team produces a strong demo video in January — good completion rate, real conversion lift, leadership happy. In March, the product ships a significant UI update. Navigation changes. A key workflow looks different. A feature gets renamed.
Nobody updates the video.
By Q2, buyers are watching a demo of a product that no longer exists. Some click through to start a trial and find a completely different experience than the video showed. Confusion creates drop-off. The activation rate tanks. Support tickets go up. The demo video hasn't just stopped performing — it's actively creating expectation mismatch at the most critical conversion moment.
A stale demo video doesn't have low ROI. It has negative ROI. That's a different problem requiring a different fix.
The most expensive demo video isn't the one that cost $15,000 to produce. It's the $4,000 video that shipped in January, went stale in March, and nobody touched until September. That video has been quietly sabotaging conversion for six months.
The solution isn't heroic update cycles. It's producing shorter, modular videos — one workflow per video, not a five-minute product tour — so that when the product changes, you swap one clip instead of rebuilding the entire asset. Teams that use AI demo video automation have a structural advantage here: production speed is fast enough to keep pace with the roadmap, so content stays current without consuming engineering resources.
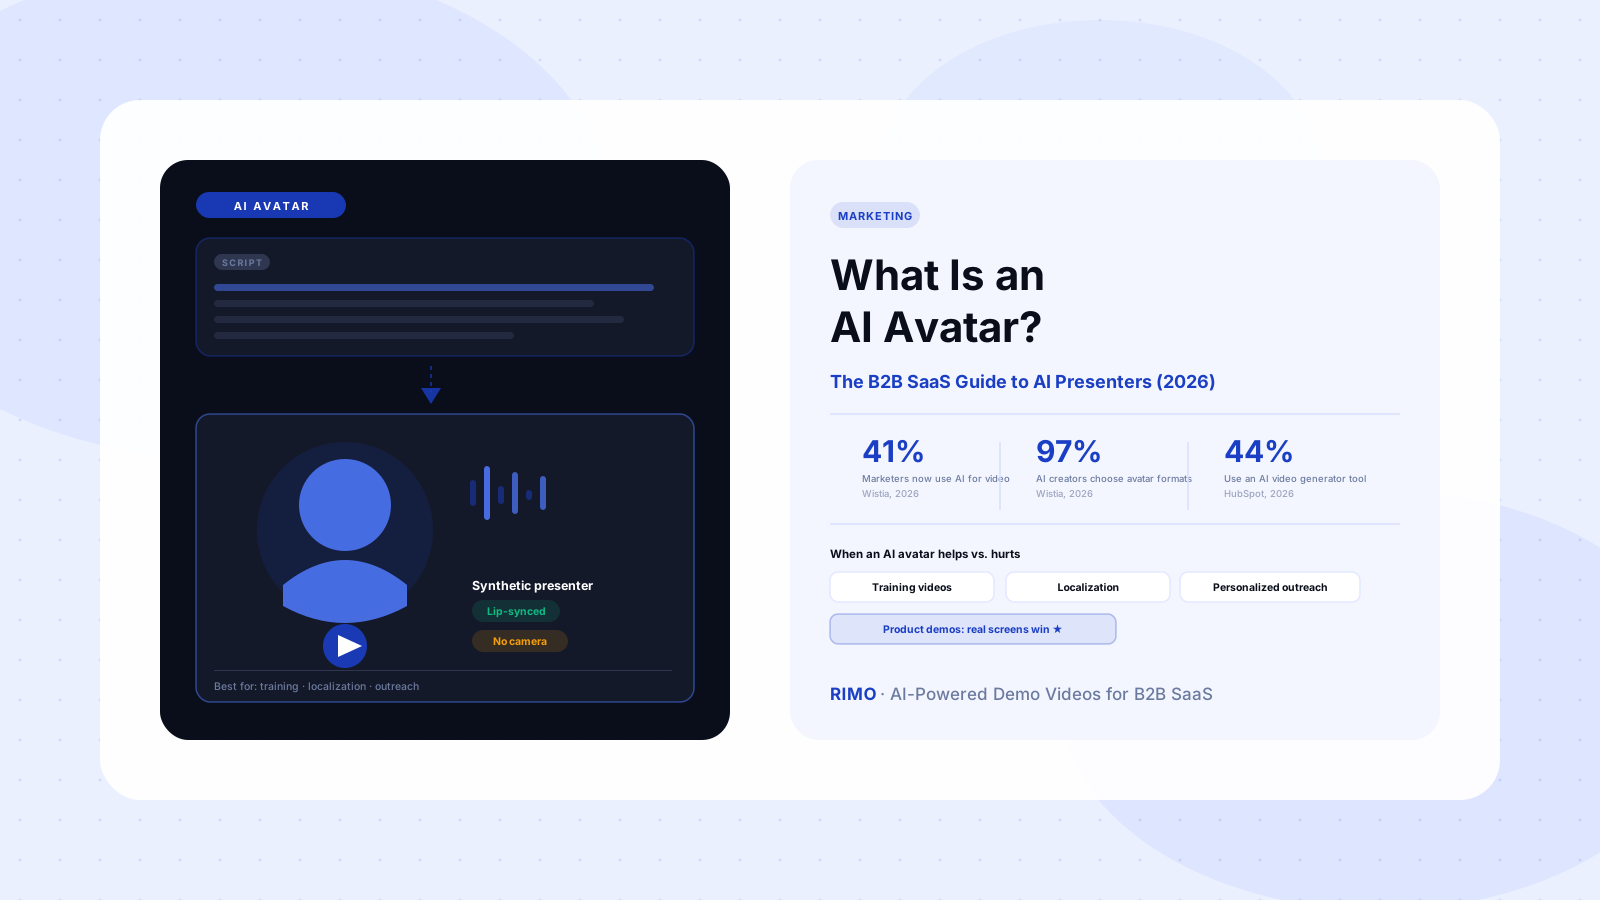
Wistia's State of Video (2025) found AI use in video production jumped from 18% to 41% in a single year. The teams driving that adoption aren't replacing video strategy — they're solving the maintenance problem that has quietly undermined demo video ROI for years.
How to improve ROI without rebuilding everything
If your demo video ROI numbers are weak, there are three places to investigate before concluding you need a new video.
The placement problem. A strong video in the wrong location produces weak numbers regardless of quality. A 3-minute use-case demo on the homepage — where buyers haven't yet developed enough context to care — will underperform even if the content is excellent. Map your video placement to buyer intent stage before optimizing anything else. The product demo video mistakes most teams make are often placement mistakes wearing the costume of content problems.
The CTA problem. Most demo videos end with nothing. The viewer finishes, and there's no next step. Every demo video needs a single, specific CTA that appears at or before the 80% completion mark — not after. Buyers who are going to leave tend to drop at the 80–85% mark. If your CTA only appears in the final five seconds, you're showing it to the people least likely to act on it.
The attribution problem. Sometimes the ROI looks weak not because the video is underperforming, but because the attribution infrastructure doesn't exist to capture what it's actually driving. Build the UTMs. Create the CRM field. Run the video-influenced pipeline report. A number of teams that do this for the first time discover their demo video program was generating significant pipeline they had no visibility into — and that the ROI was always there, just invisible.
If you've fixed placement, CTA, and attribution and the numbers still don't hold, then it's a content problem. At that point, the B2B SaaS demo script template approach — starting from a buyer-specific brief rather than a product feature list — is usually the right reset.
Try Rimo free → rimodreamlabs.ai
FAQ
What is a good ROI for a product demo video?
A healthy product demo video ROI for B2B SaaS sits above 300% when using conservative multi-touch attribution. Well-optimized programs regularly reach 500–700%. The key drivers are production cost (significantly lower with AI-assisted workflows) and the value of each video-influenced deal. Even modest attribution assumptions tend to produce strong returns because demo video production cost is low relative to average B2B deal sizes.
How do I measure product demo video ROI without a data team?
Start with Level 1 — play rate and completion rate from your video hosting platform. Then add Level 2 by tagging your video landing pages with UTM parameters and tracking downstream conversion events in Google Analytics or your CRM. Level 3 revenue attribution requires a "video touched" field in your CRM, which any HubSpot or Salesforce admin can create without engineering help. Build each level sequentially rather than trying to do everything at once.
What metrics matter most for product demo video ROI?
Two metrics predict ROI most directly: demo booking rate from video viewers (target: 8–15% for B2B SaaS) and video-influenced pipeline as a share of total pipeline (target: 20–40%). Play rate and completion rate are diagnostic — useful for improving the video, but insufficient for measuring business impact. If you can only track two things, track pipeline influence and booking rate.
How often should B2B SaaS teams update their demo videos?
Any major UI change, workflow update, or feature rename warrants an update. For fast-shipping teams, this can mean quarterly refreshes. Keeping videos short and modular — one specific workflow per video, rather than a full product tour — is what makes updates manageable. A five-minute product tour becomes a full production project every time the product ships. A library of 90-second use-case clips can be maintained one clip at a time.
Does a higher-quality demo video produce higher ROI?
Not necessarily — placement and attribution setup matter more than production quality for ROI measurement. A well-placed, properly attributed video of average quality will outperform a beautifully produced video with no UTMs, no CTA, and no CRM connection. Invest in quality once the measurement infrastructure exists. You'll know exactly which improvements moved the number.
Can I measure product demo video ROI without a dedicated analytics platform?
Yes, with three manual steps: (1) UTM-tag every video landing page URL; (2) track conversions from those URLs in Google Analytics with goal completions; (3) manually flag CRM contact records when a prospect clicks through from a video URL. It's not fully automated, but it's enough to build a directionally accurate ROI number. Most teams are surprised by what they find — and that number is usually enough to justify a proper analytics tool.
Akshay Sharma
Product Leader · 10+ years in B2B SaaS
Akshay has spent 10+ years building and marketing B2B SaaS products. He writes about product storytelling, demo production, and the operational side of product marketing.